UNITED STATES / STATE COLOUR STUDY
The colours of North Carolina.
A place, seen through its palette. Explore the image colours within North Carolina’s boundary, from the annual blend to twelve individual months.
NASA Blue Marble · 2004 · 500 m source imagery · Land within the selected boundary
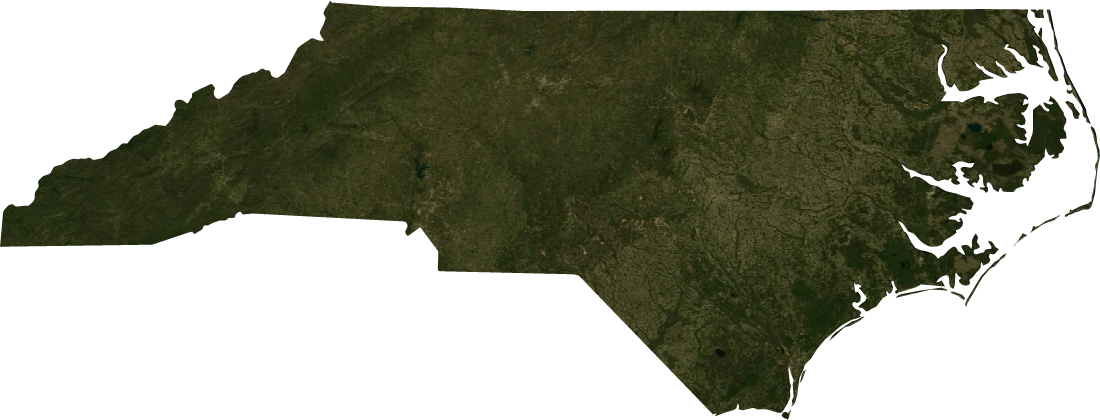
THE REGION, IN ONE COLOUR
RGB 54 · 56 · 27
An area-weighted average of image colours inside the boundary. It is a blend, not the most common colour.
The palette within
Representative colour groups · click a hex code to copy
Percentages are shares of area-weighted image colours, not forest, water or other land-cover percentages.
ONE PLACE, TWELVE MONTHS
A year in colour
Select a month to change the map and palette above. These are the supplied 2004 images, not typical seasonal averages.
SIX MONTHS APART
January & July
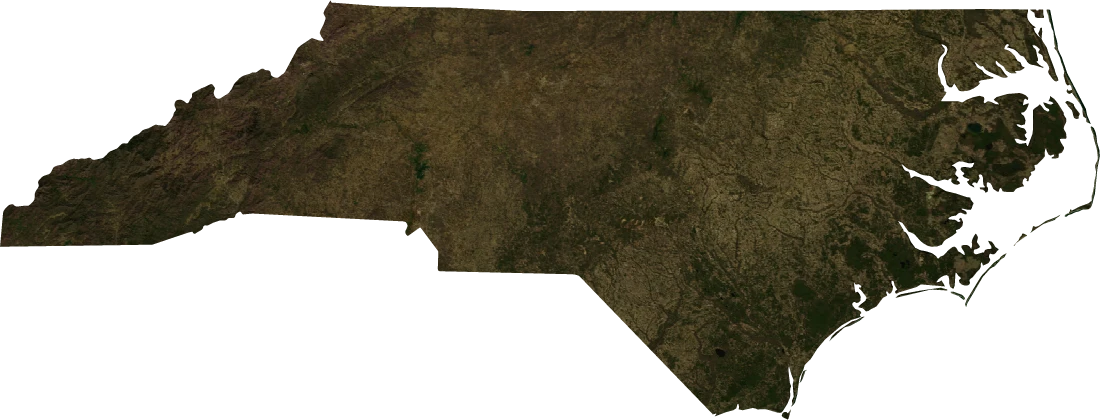
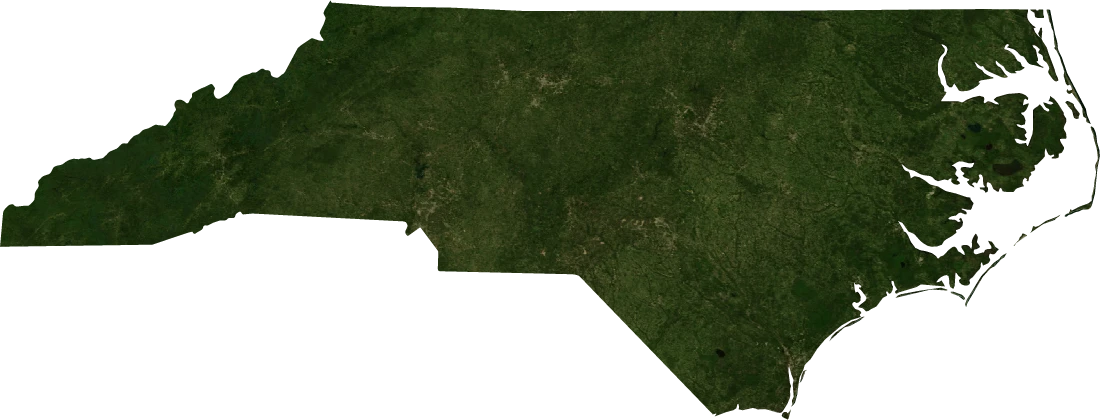
Compare the same boundary in two supplied months. Differences describe the imagery; they do not establish climate trends or explain the causes of change.
READING THIS PROFILE
A blend, a palette,
and a year of images.
The annual image mean for North Carolina is #36381B. January’s regional mean is #3E361E, compared with #293614 in July. Each value combines image pixels across the boundary, with fractional edge coverage and spherical area weights.
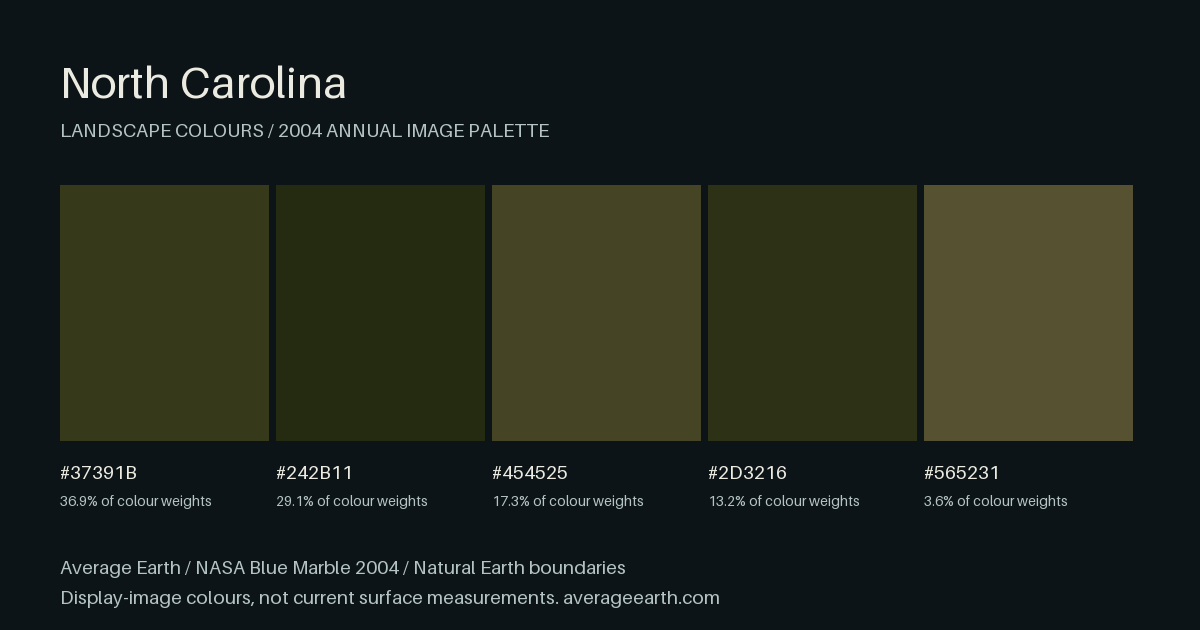
The largest annual colour group represents approximately 36.9% of the colour weights and has representative hex value #37391B. The palette groups similar colours; it does not classify land use.
This follows Natural Earth’s North Carolina boundary feature, with large boundary lakes removed. The calculations use NASA’s full-resolution 2004 base maps. The world atlas uses a coarser lookup, so its individual point samples are not equivalent to these regional averages.
TAKE THE COLOURS WITH YOU
A palette worth keeping.
Download the annual palette card, or all thirteen views’ colour data with sources attached.
Sources & sampling
What was sampled
The boundary covers the equivalent of about 730,965 complete source pixels. A source pixel spans 1/240°—about 463 metres north–south. These are broad image colours, not street-level measurements.
Approximately 99% of the sampled pixel coverage lies in cells at least 15/16 inside the boundary. Mixed coastal pixels can still contain water colours.
How it was prepared
Boundary coverage is estimated with 4 × 4 subpixel samples. Colours are averaged in linear light and weighted by spherical cell area. The annual image weights the twelve months by their days in leap year 2004. Five deterministic colour groups form each palette.
Maps use a local equirectangular display, with longitude scaled at the region’s mid-latitude. Display images sample the native imagery; every covered source pixel contributes to the statistics. Small regions open as a colour-filled outline when satellite detail is limited.
Imagery: NASA Blue Marble Next Generation. Boundaries: Natural Earth 5.1.1, 1:10m, public domain, default de facto geography with large boundary lakes removed. Boundaries are not a statement about sovereignty and may differ from those in 2004. Image processing can influence colour. No NASA endorsement is implied. More about the atlas method.
All monthly average colours
| Period | Hex | RGB |
|---|---|---|
| Annual mean | #36381B | 54, 56, 27 |
| January | #3E361E | 62, 54, 30 |
| February | #443921 | 68, 57, 33 |
| March | #443E23 | 68, 62, 35 |
| April | #3F4222 | 63, 66, 34 |
| May | #38421E | 56, 66, 30 |
| June | #2F3D19 | 47, 61, 25 |
| July | #293614 | 41, 54, 20 |
| August | #253312 | 37, 51, 18 |
| September | #273013 | 39, 48, 19 |
| October | #2C2F15 | 44, 47, 21 |
| November | #312F18 | 49, 47, 24 |
| December | #37321B | 55, 50, 27 |